Chart Vizzard
Vizzlos KI-basierter Diagramm-Generator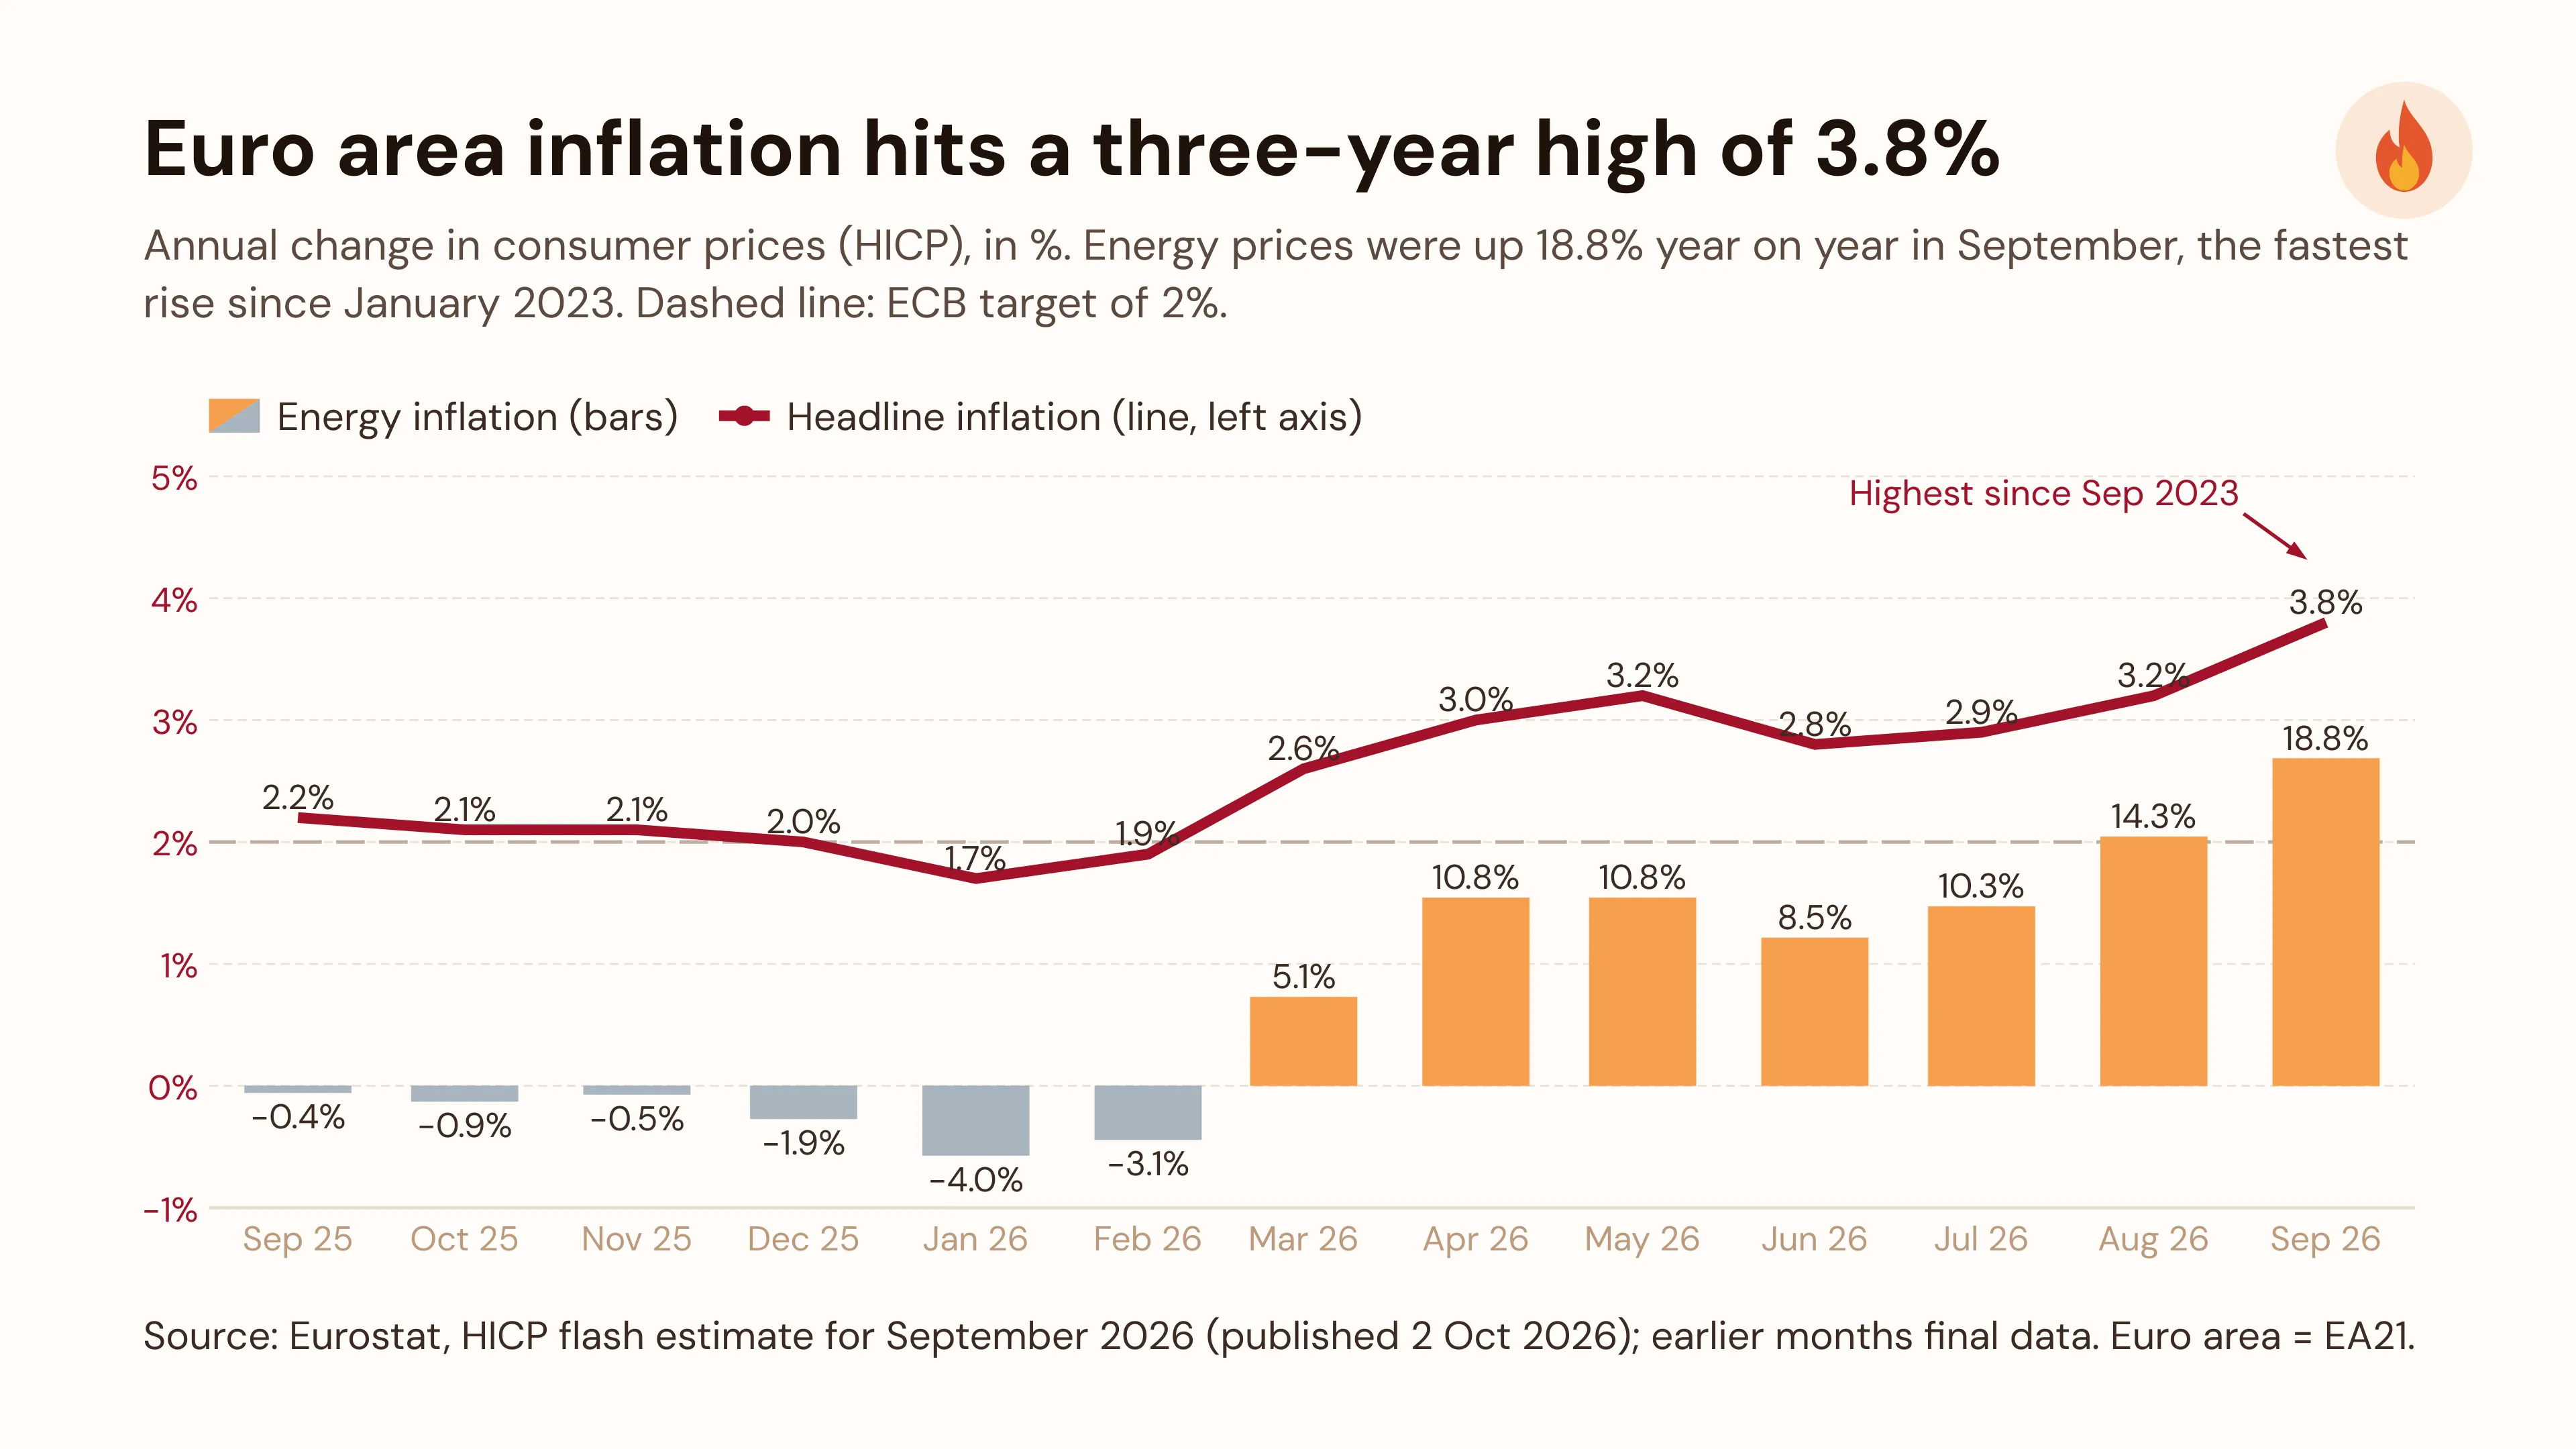
Euro area inflation hits a three-year high of 3.8%
Euro area inflation hits a three-year high of 3.8%
Euro area annual inflation rose to 3.8% in September 2026, up from 3.2% in August, according to Eurostat’s flash estimate published on 2 October 2026. That is the highest rate since September 2023, and it came in above the consensus forecast of about 3.6%.
Energy drives the rise
The main driver is energy. Energy prices rose 18.8% year on year in September, up from 14.3% in August and the fastest increase since January 2023. Energy was still deflationary at the start of the year (−4.0% in January, −3.1% in February), then rose sharply from March:
| Month | Headline HICP | Energy |
|---|---|---|
| Sep 2025 | 2.2% | −0.4% |
| Jan 2026 | 1.7% | −4.0% |
| Mar 2026 | 2.6% | 5.1% |
| Apr 2026 | 3.0% | 10.8% |
| Aug 2026 | 3.2% | 14.3% |
| Sep 2026 (flash) | 3.8% | 18.8% |
Other components in September (flash):
- Services: 3.2% (August: 3.0%)
- Food, alcohol & tobacco: 1.4% (August: 1.1%)
- Non-energy industrial goods: 1.1% (August: 1.2%)
Energy accounts for only about 9% of the HICP basket, yet Euronews estimates it explained close to half of September’s headline rate. Media reports link the energy surge to the conflict in the Middle East.
What it means for the ECB
Headline inflation is now nearly twice the ECB’s 2% target (dashed line in the chart). The ECB raised rates on 10 September 2026, its second hike this year, and markets expect another increase at the 29 October meeting.
How to read the chart
- Red line (left axis): headline HICP inflation, annual rate of change in %.
- Bars: energy inflation, annual rate of change in %. Grey bars are negative, orange bars positive. The bars use their own scale, so the right axis labels are hidden and every bar carries its value label instead.
- Dashed line: the ECB’s 2% medium-term inflation target.
Sources
- Eurostat: Euro area annual inflation up to 3.8%, flash estimate for September 2026, published 2 Oct 2026
- Eurostat: Annual inflation up to 3.2% in the euro area, August 2026 final data (March–August 2026), published 17 Sep 2026
- Eurostat: Annual inflation up to 2.6% in the euro area, March 2026 data (October 2025–February 2026), published 16 Apr 2026
- Eurostat database: HICP monthly annual rate of change (prc_hicp_manr), September 2025 values
- Euronews: Eurozone inflation spikes to 3.8%, 2 Oct 2026
- ANI: Inflation in Europe jumps to 3.8% in September, energy inflation at 18.8%, 2 Oct 2026
- Khaleej Times: ECB raises interest rates, bolstering bets for further moves, 10 Sep 2026
Notes
- September 2026 is a flash estimate. Eurostat publishes the final figure on 16 October 2026. All earlier months are final data.
- The euro area covers 21 member states (EA21, including Bulgaria from 2026).
- Figures are rounded to one decimal place, as published by Eurostat.
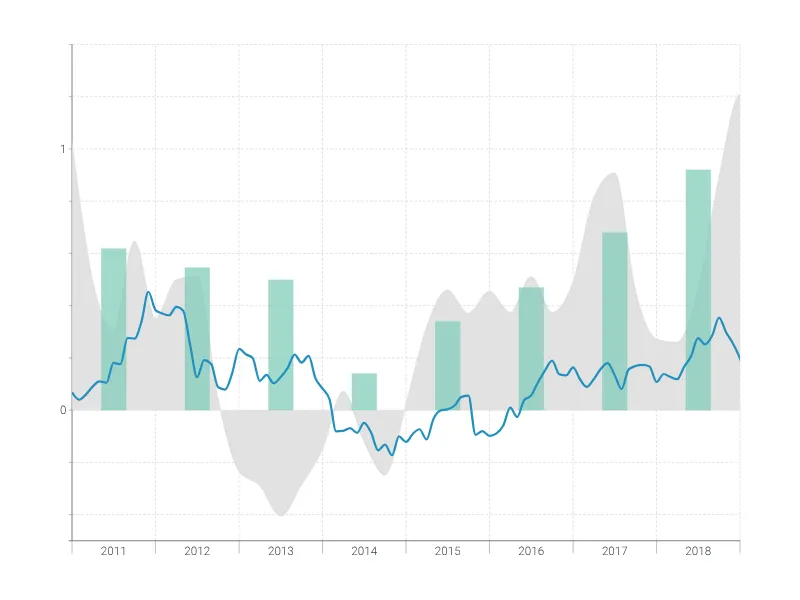
Dies ist ein Beispiel für Vizzlos "Zeitreihendiagramm"
Komplexes Zeitreihendiagramm zur Visualisierung detaillierter Finanzdaten.
Finanzen & Wirtschaft Balken- & Säulendiagramme Linien- & Flächendiagramme Zeitbasierte Diagramme