Chart Vizzard
Vizzlos KI-basierter Diagramm-Generator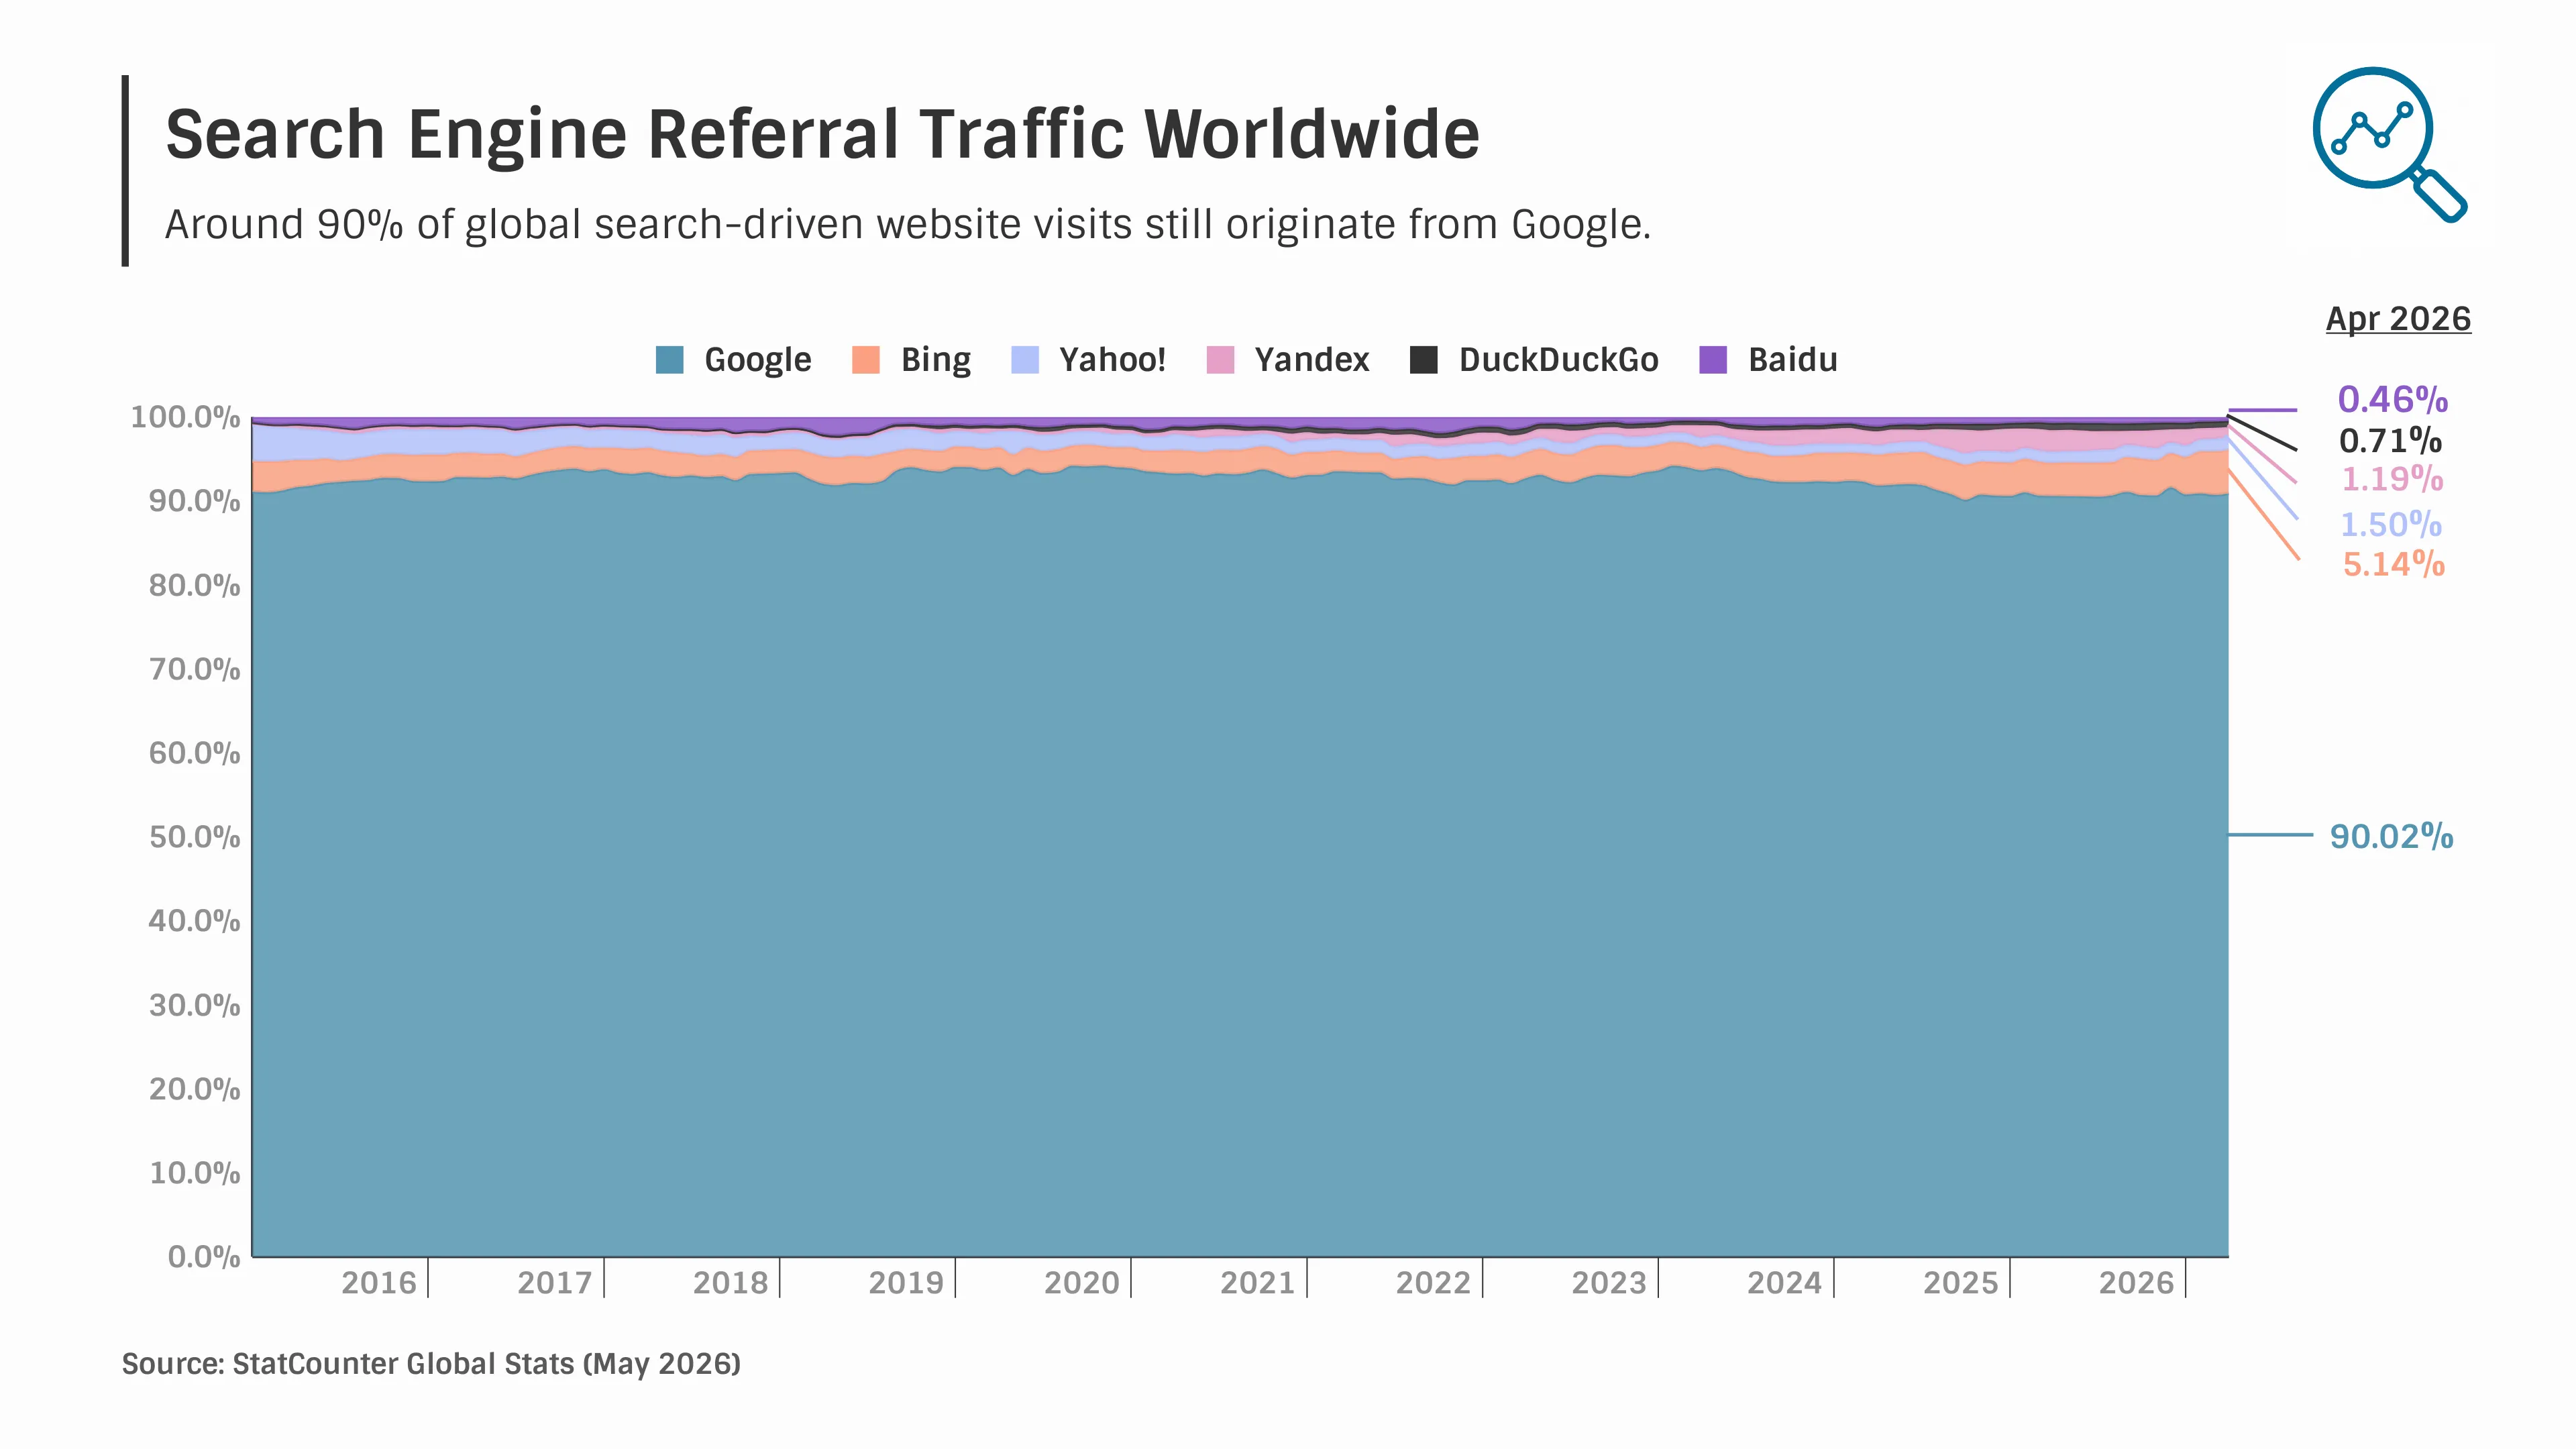
Search Engine Referral Traffic Worldwide
This 100% stacked time series graph illustrates the distribution of global search engine referral traffic between 2015 and 2026. Each colored area represents the share of website visits referred by a major search engine, including Google, Bing, Yahoo!, Yandex, DuckDuckGo, and Baidu, allowing readers to observe how the competitive landscape has evolved over time.
The visualization highlights Google’s sustained dominance throughout the entire period, consistently accounting for around 90% of worldwide search referrals. At the same time, Bing has gradually increased its share, surpassing 5% by early 2026, while Yahoo! has continued to decline. Other search engines, including Yandex, DuckDuckGo, and Baidu, maintain relatively small but stable shares, reflecting the presence of regional and privacy-focused alternatives.
Using a 100% stacked time series graph emphasizes both the overwhelming market position of Google and the subtle shifts among competing search engines. The layout makes it easy to compare changes in market composition while preserving the overall context of the search ecosystem. End-of-series labels further improve readability by clearly identifying each engine’s latest market share.
This chart is useful for analyzing trends in search engine competition, referral traffic distribution, digital marketing, SEO strategy, and the evolving search landscape. It is particularly relevant for presentations and reports related to search marketing, website analytics, online advertising, competitive intelligence, and digital business strategy.
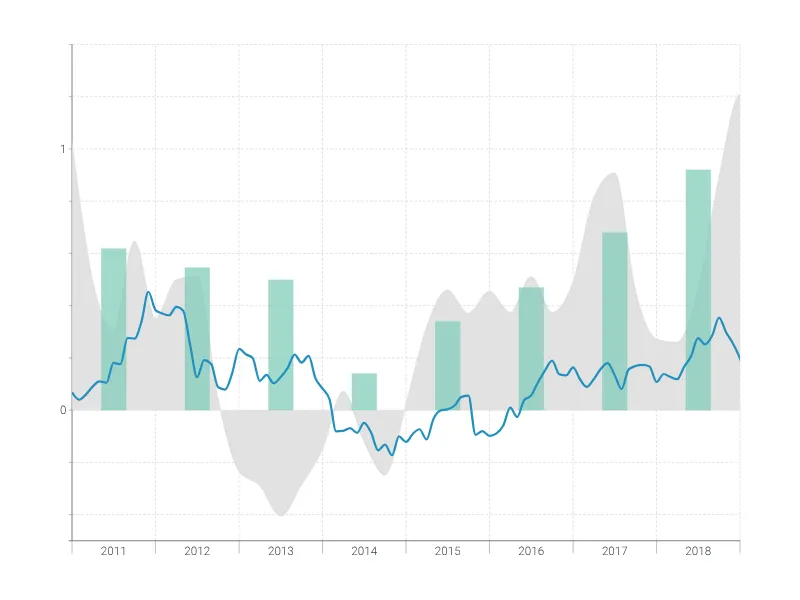
Dies ist ein Beispiel für Vizzlos "Zeitreihendiagramm"
Komplexes Zeitreihendiagramm zur Visualisierung detaillierter Finanzdaten.
Finanzen & Wirtschaft Balken- & Säulendiagramme Linien- & Flächendiagramme Zeitbasierte Diagramme