






Spend less time formatting.
More time on the analysis.
Build and update professional charts faster, so your team can focus on the insights, recommendations, and client work that matter most.
-
 Create charts faster
-
 Update without rebuilding
-
 Keep presentations consistent
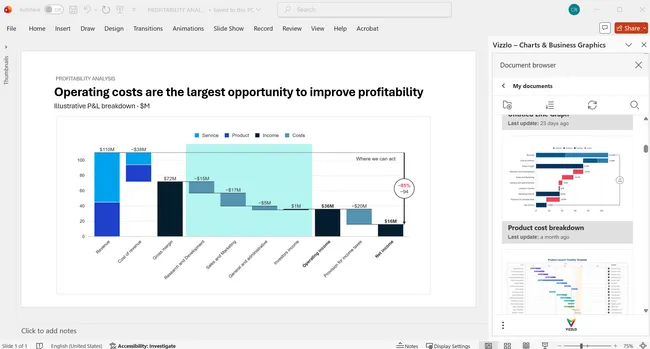
From analysis to client-ready slides
-
Start with your data
Paste your data or import it from your workflow.
-
Choose the right chart
Choose the chart type that best communicates your analysis.
-
Highlight the insight
Add callouts, benchmarks, reference lines, and annotations.
-
Present
Create and edit the chart directly in your client deck.
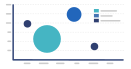
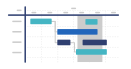
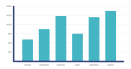
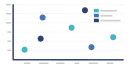
The right chart for every analysis
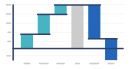
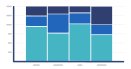
Choose from 120+ chart types for reporting, forecasting, and performance analysis
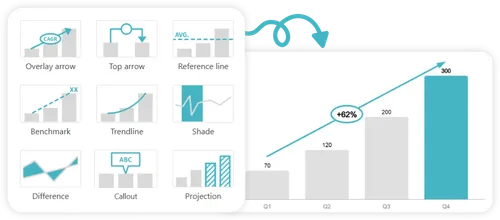
Make the key takeaway impossible to miss
Use highlights, annotations, benchmarks, and context to direct attention to the insight that matters most.
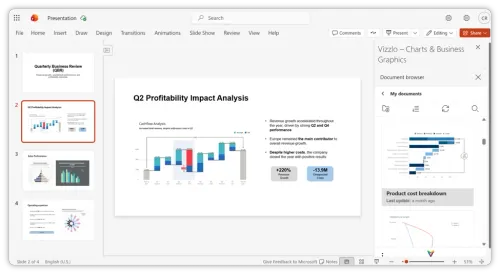
Built for the way consultants already work
Create charts in PowerPoint for Windows, Mac, and the web, with Vizzlo also available in Google Slides and online.


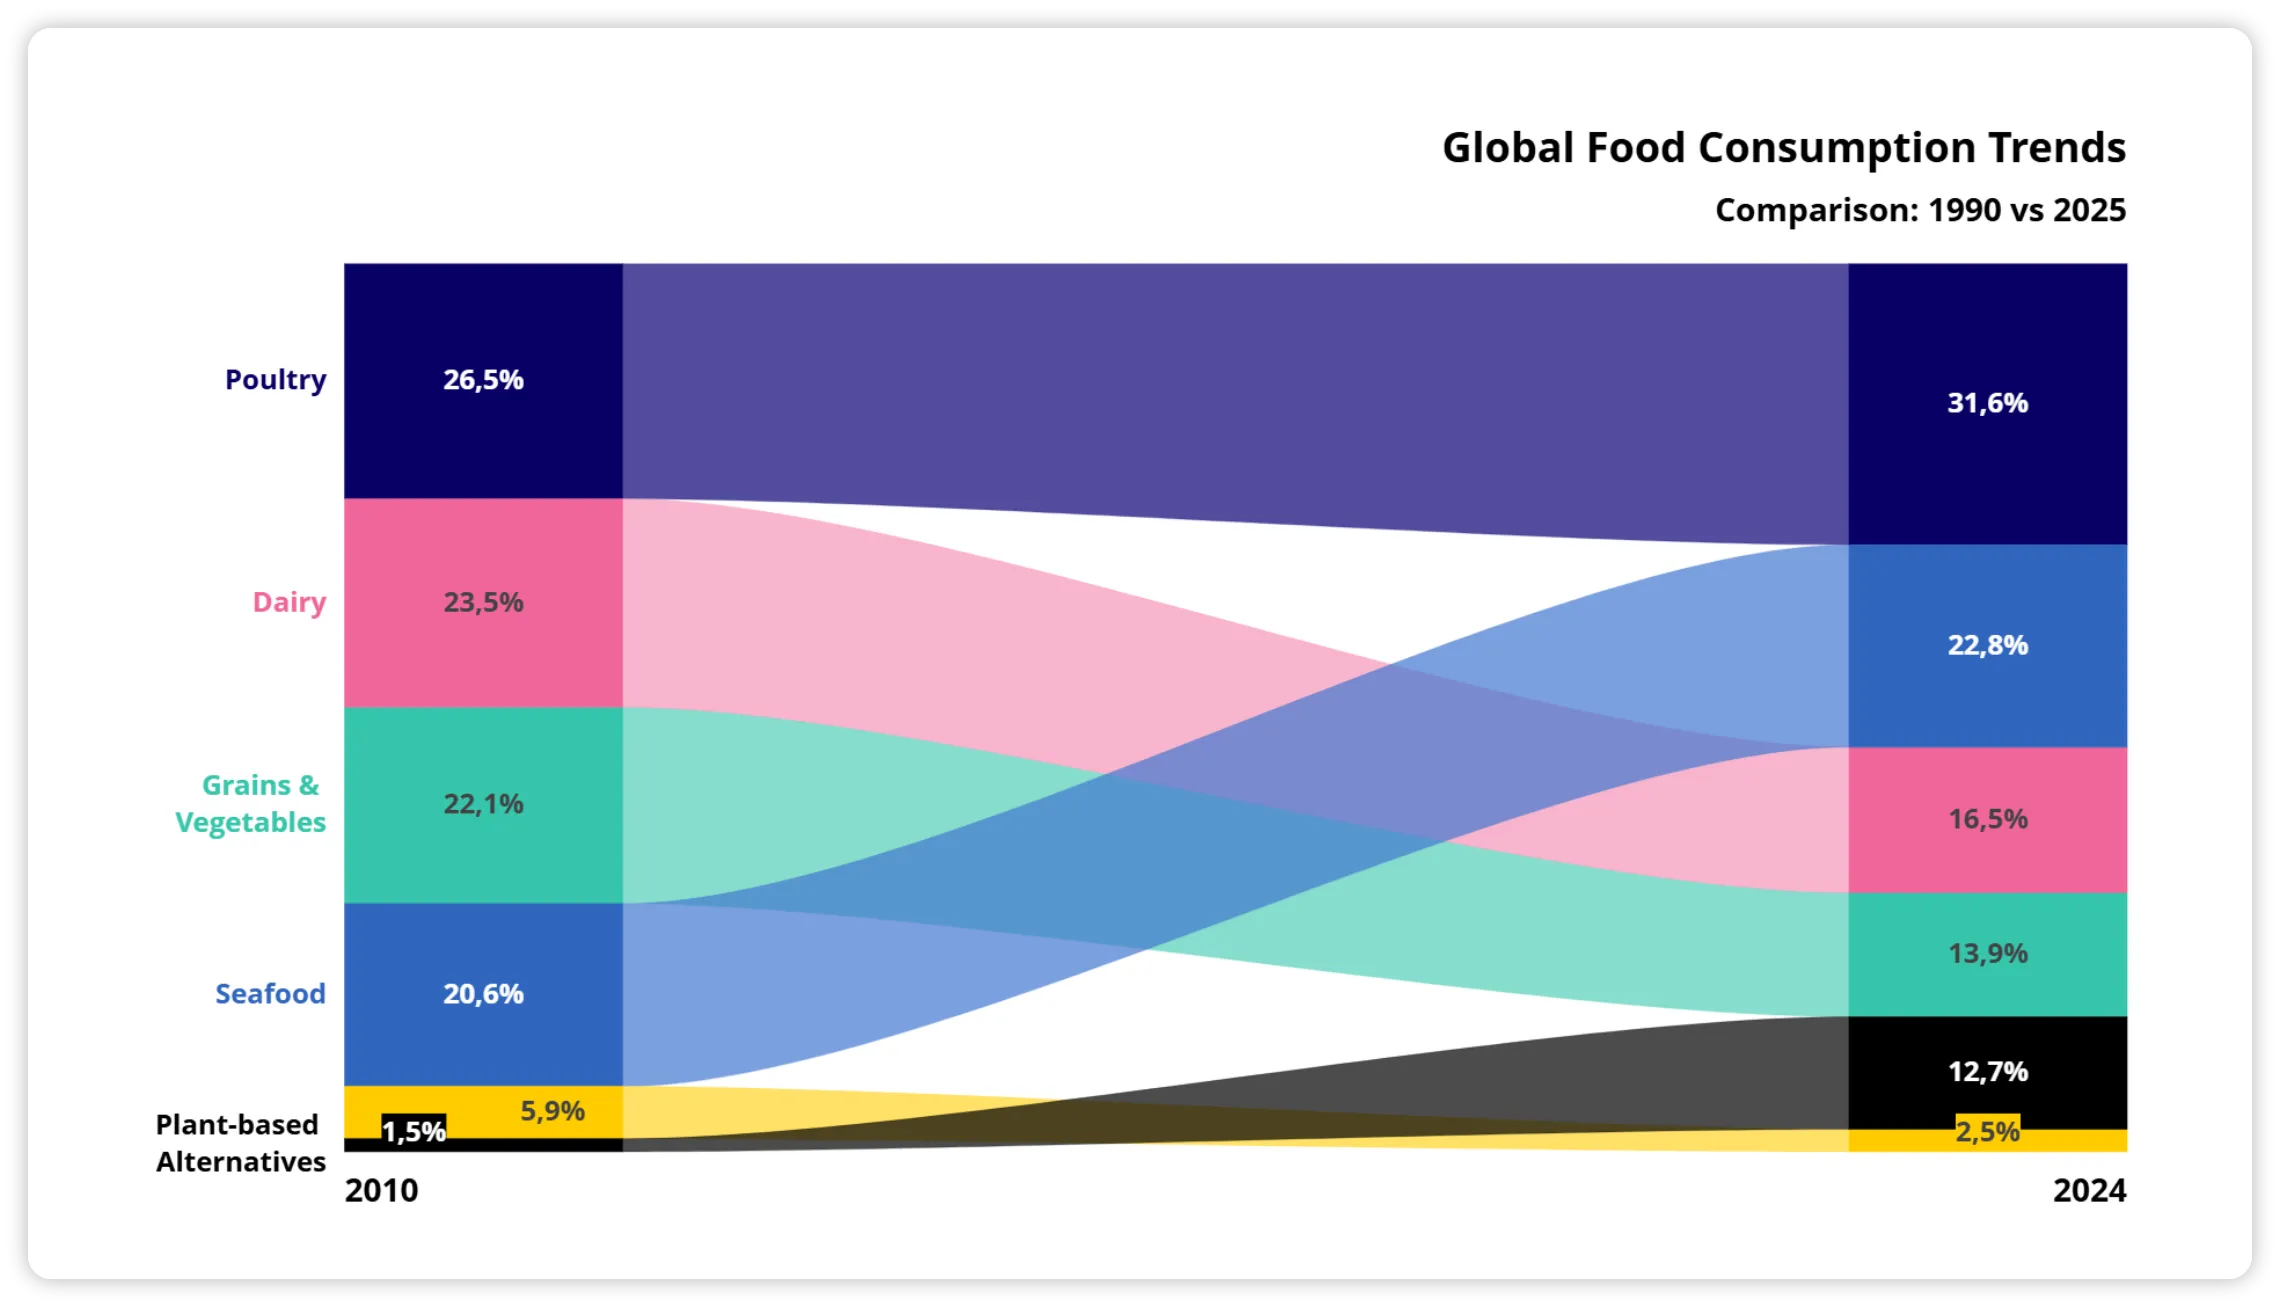
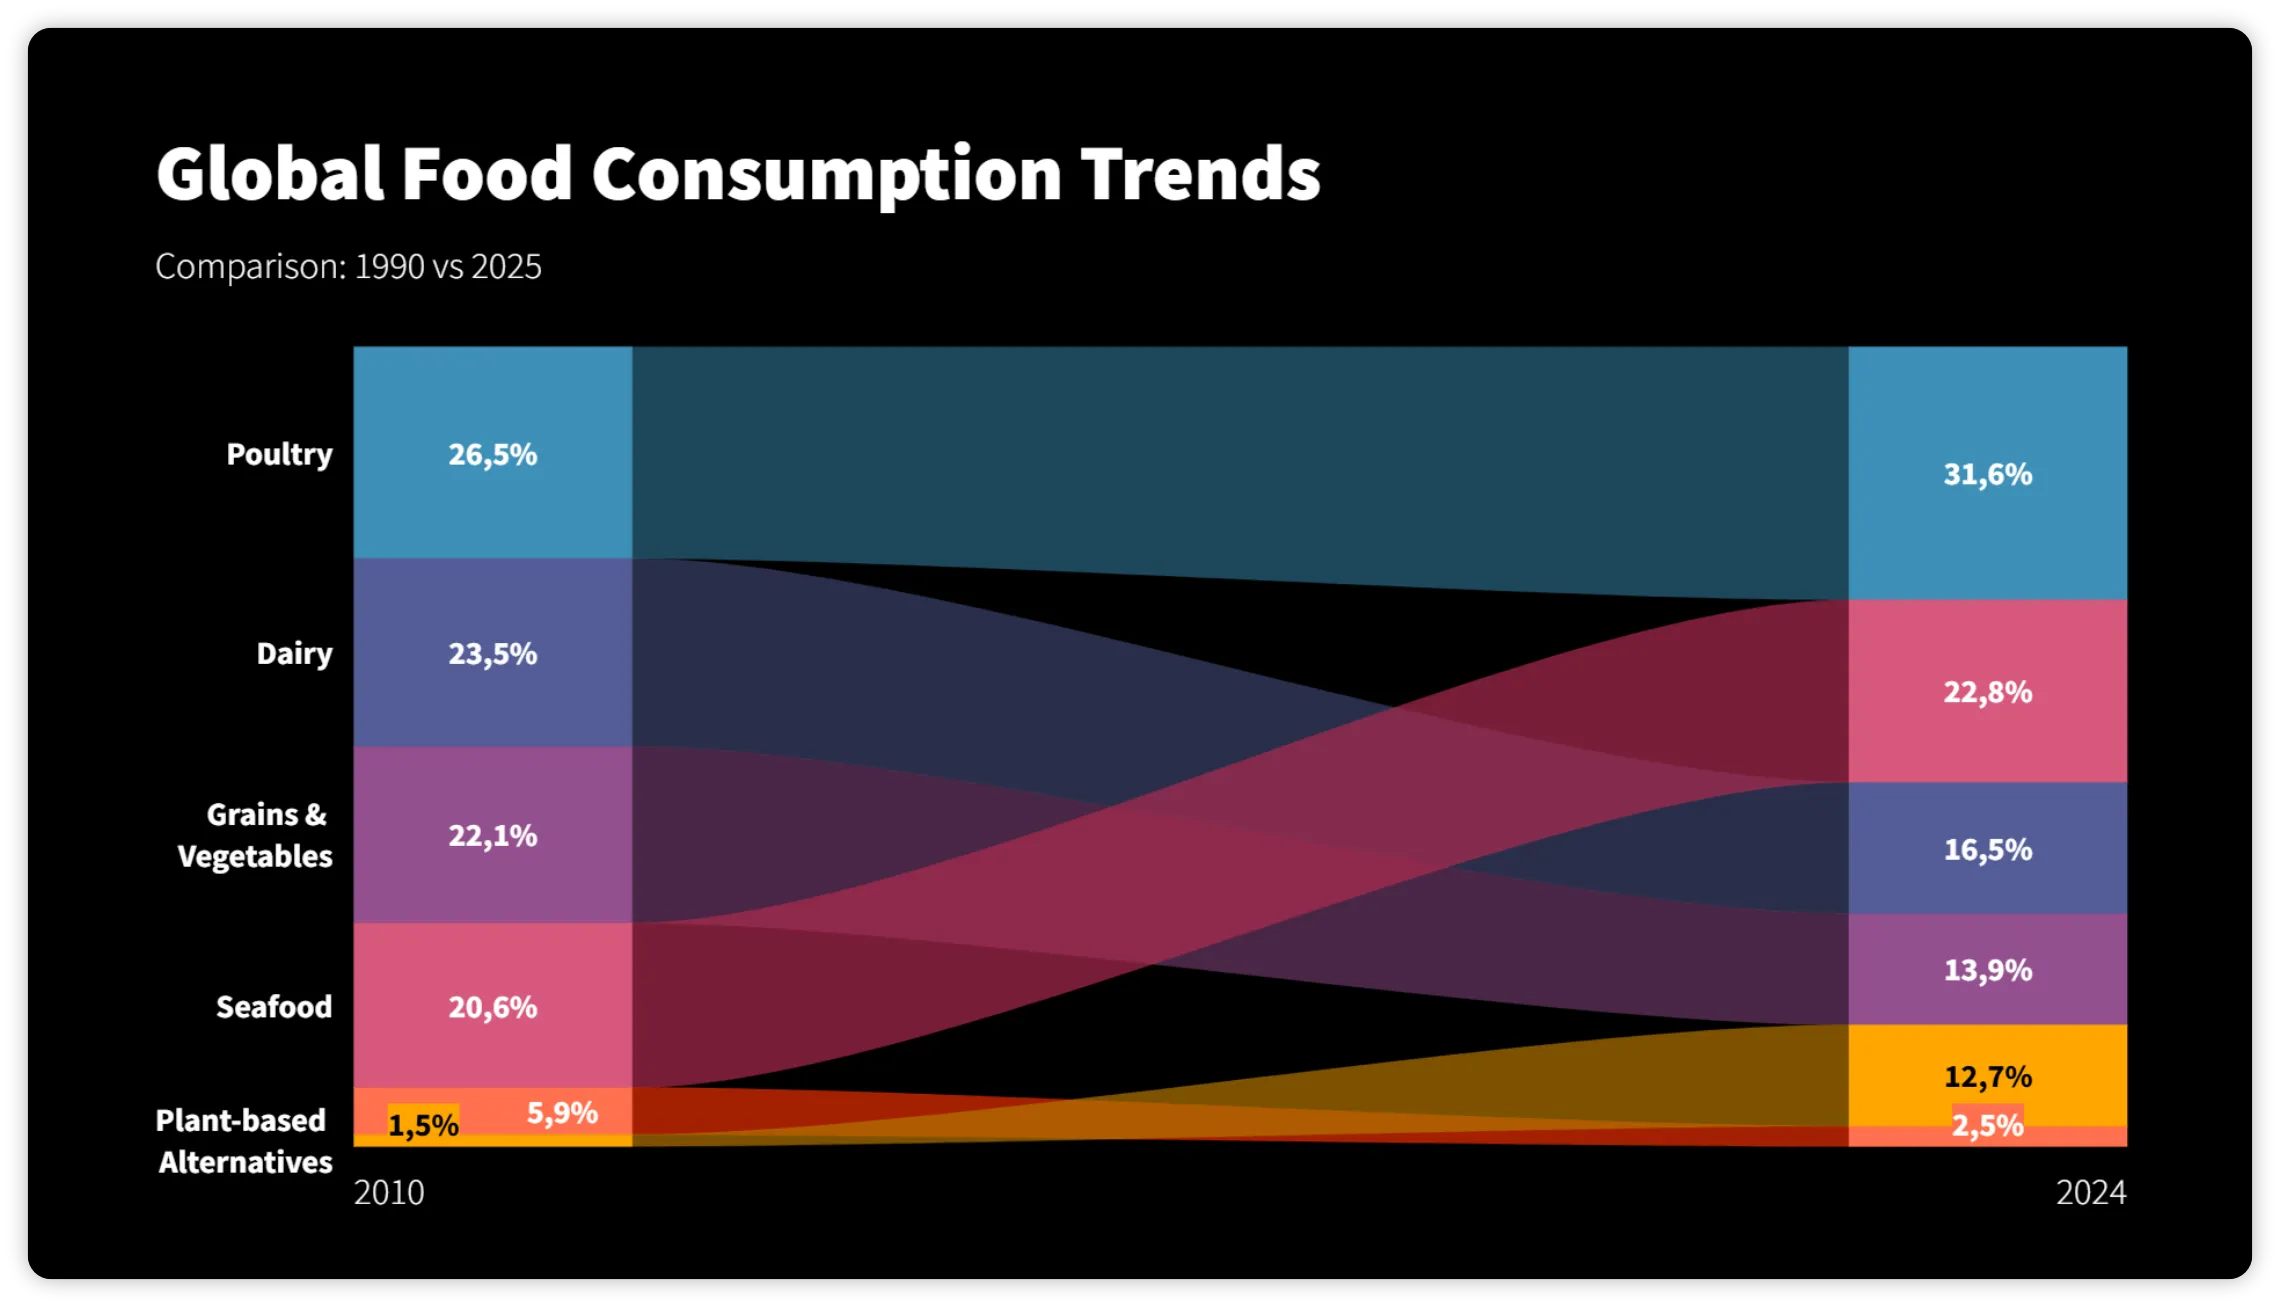
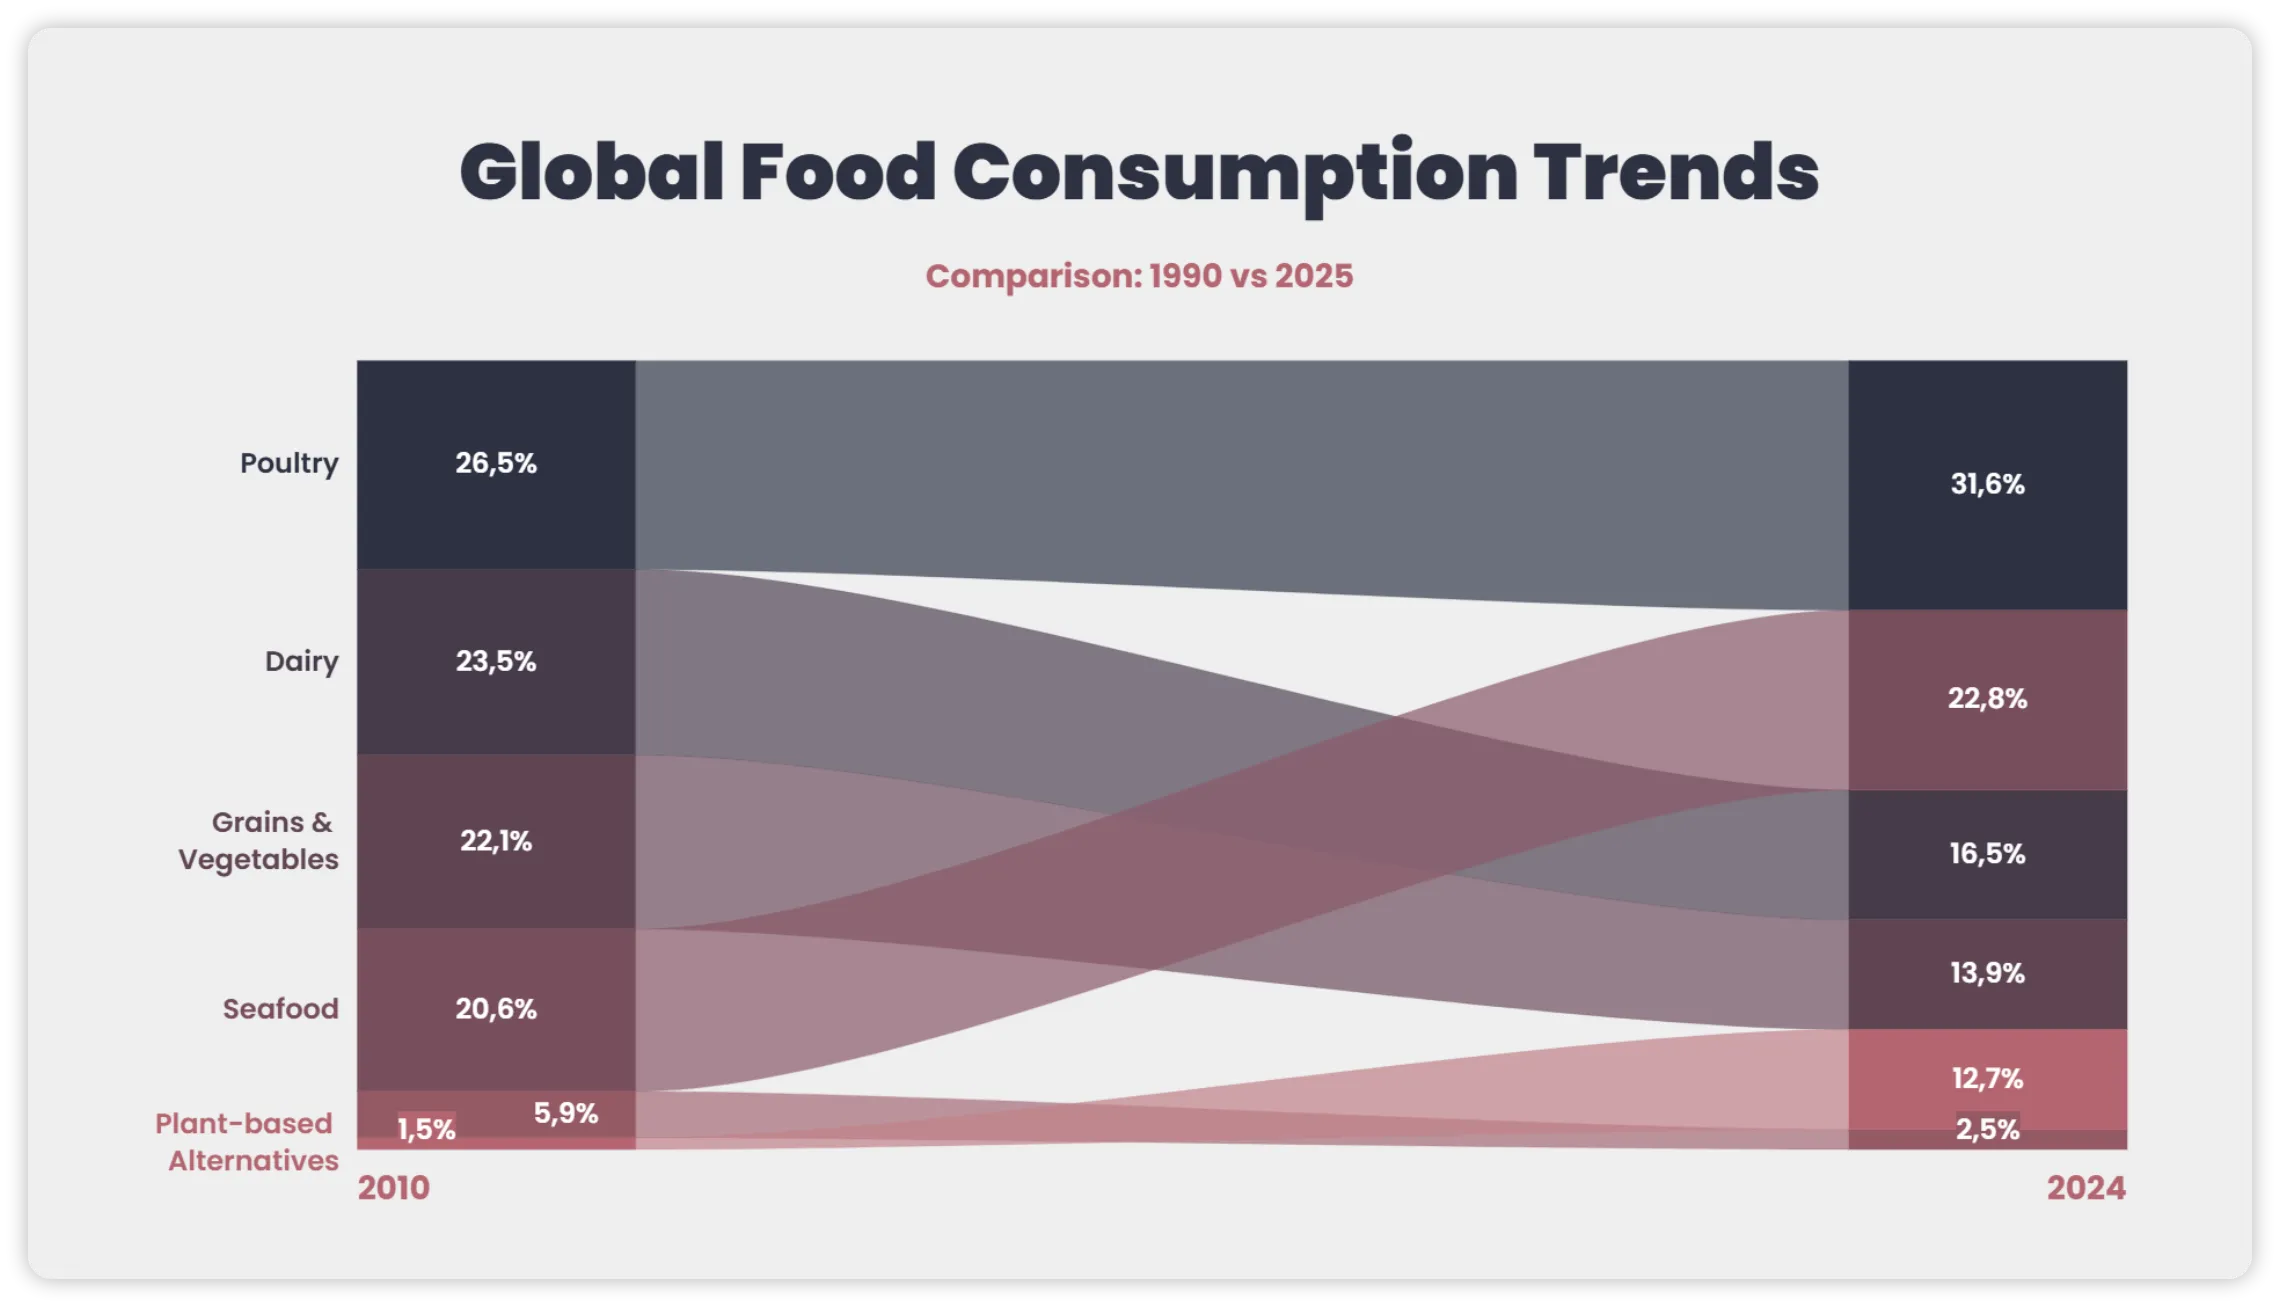
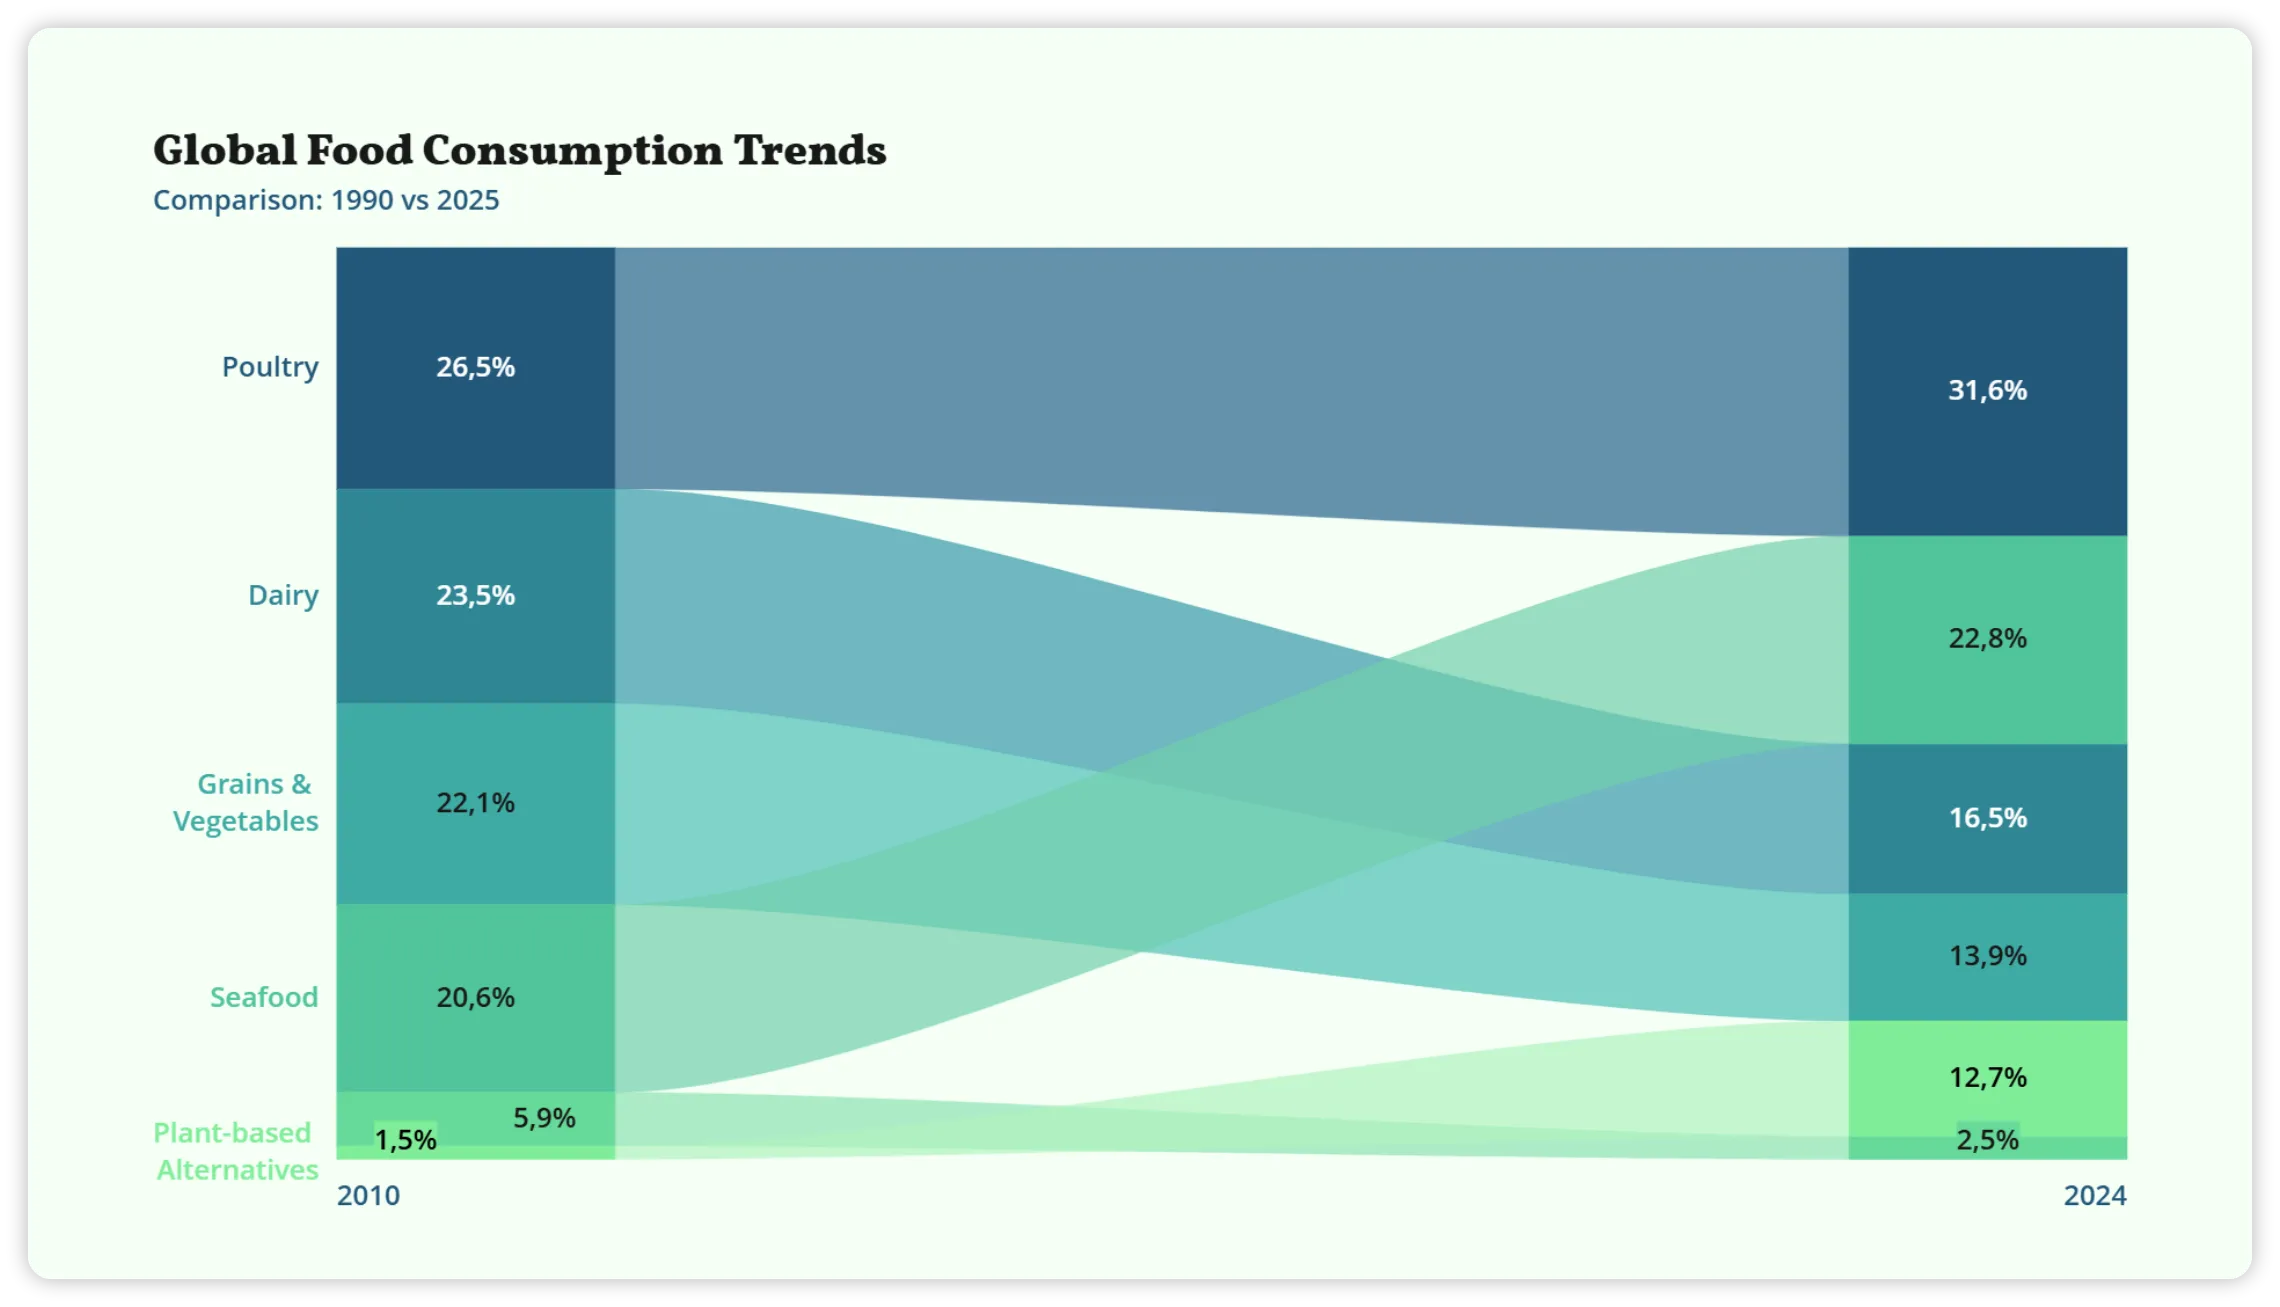
Consistent charts across every client deck
Standardize charts across teams and client decks while keeping your firm’s colors, fonts, templates, and access under control.
- Shared themes
- Brand colors & fonts
- Reusable templates


