Chart Vizzard
Vizzlo's AI-based chart generator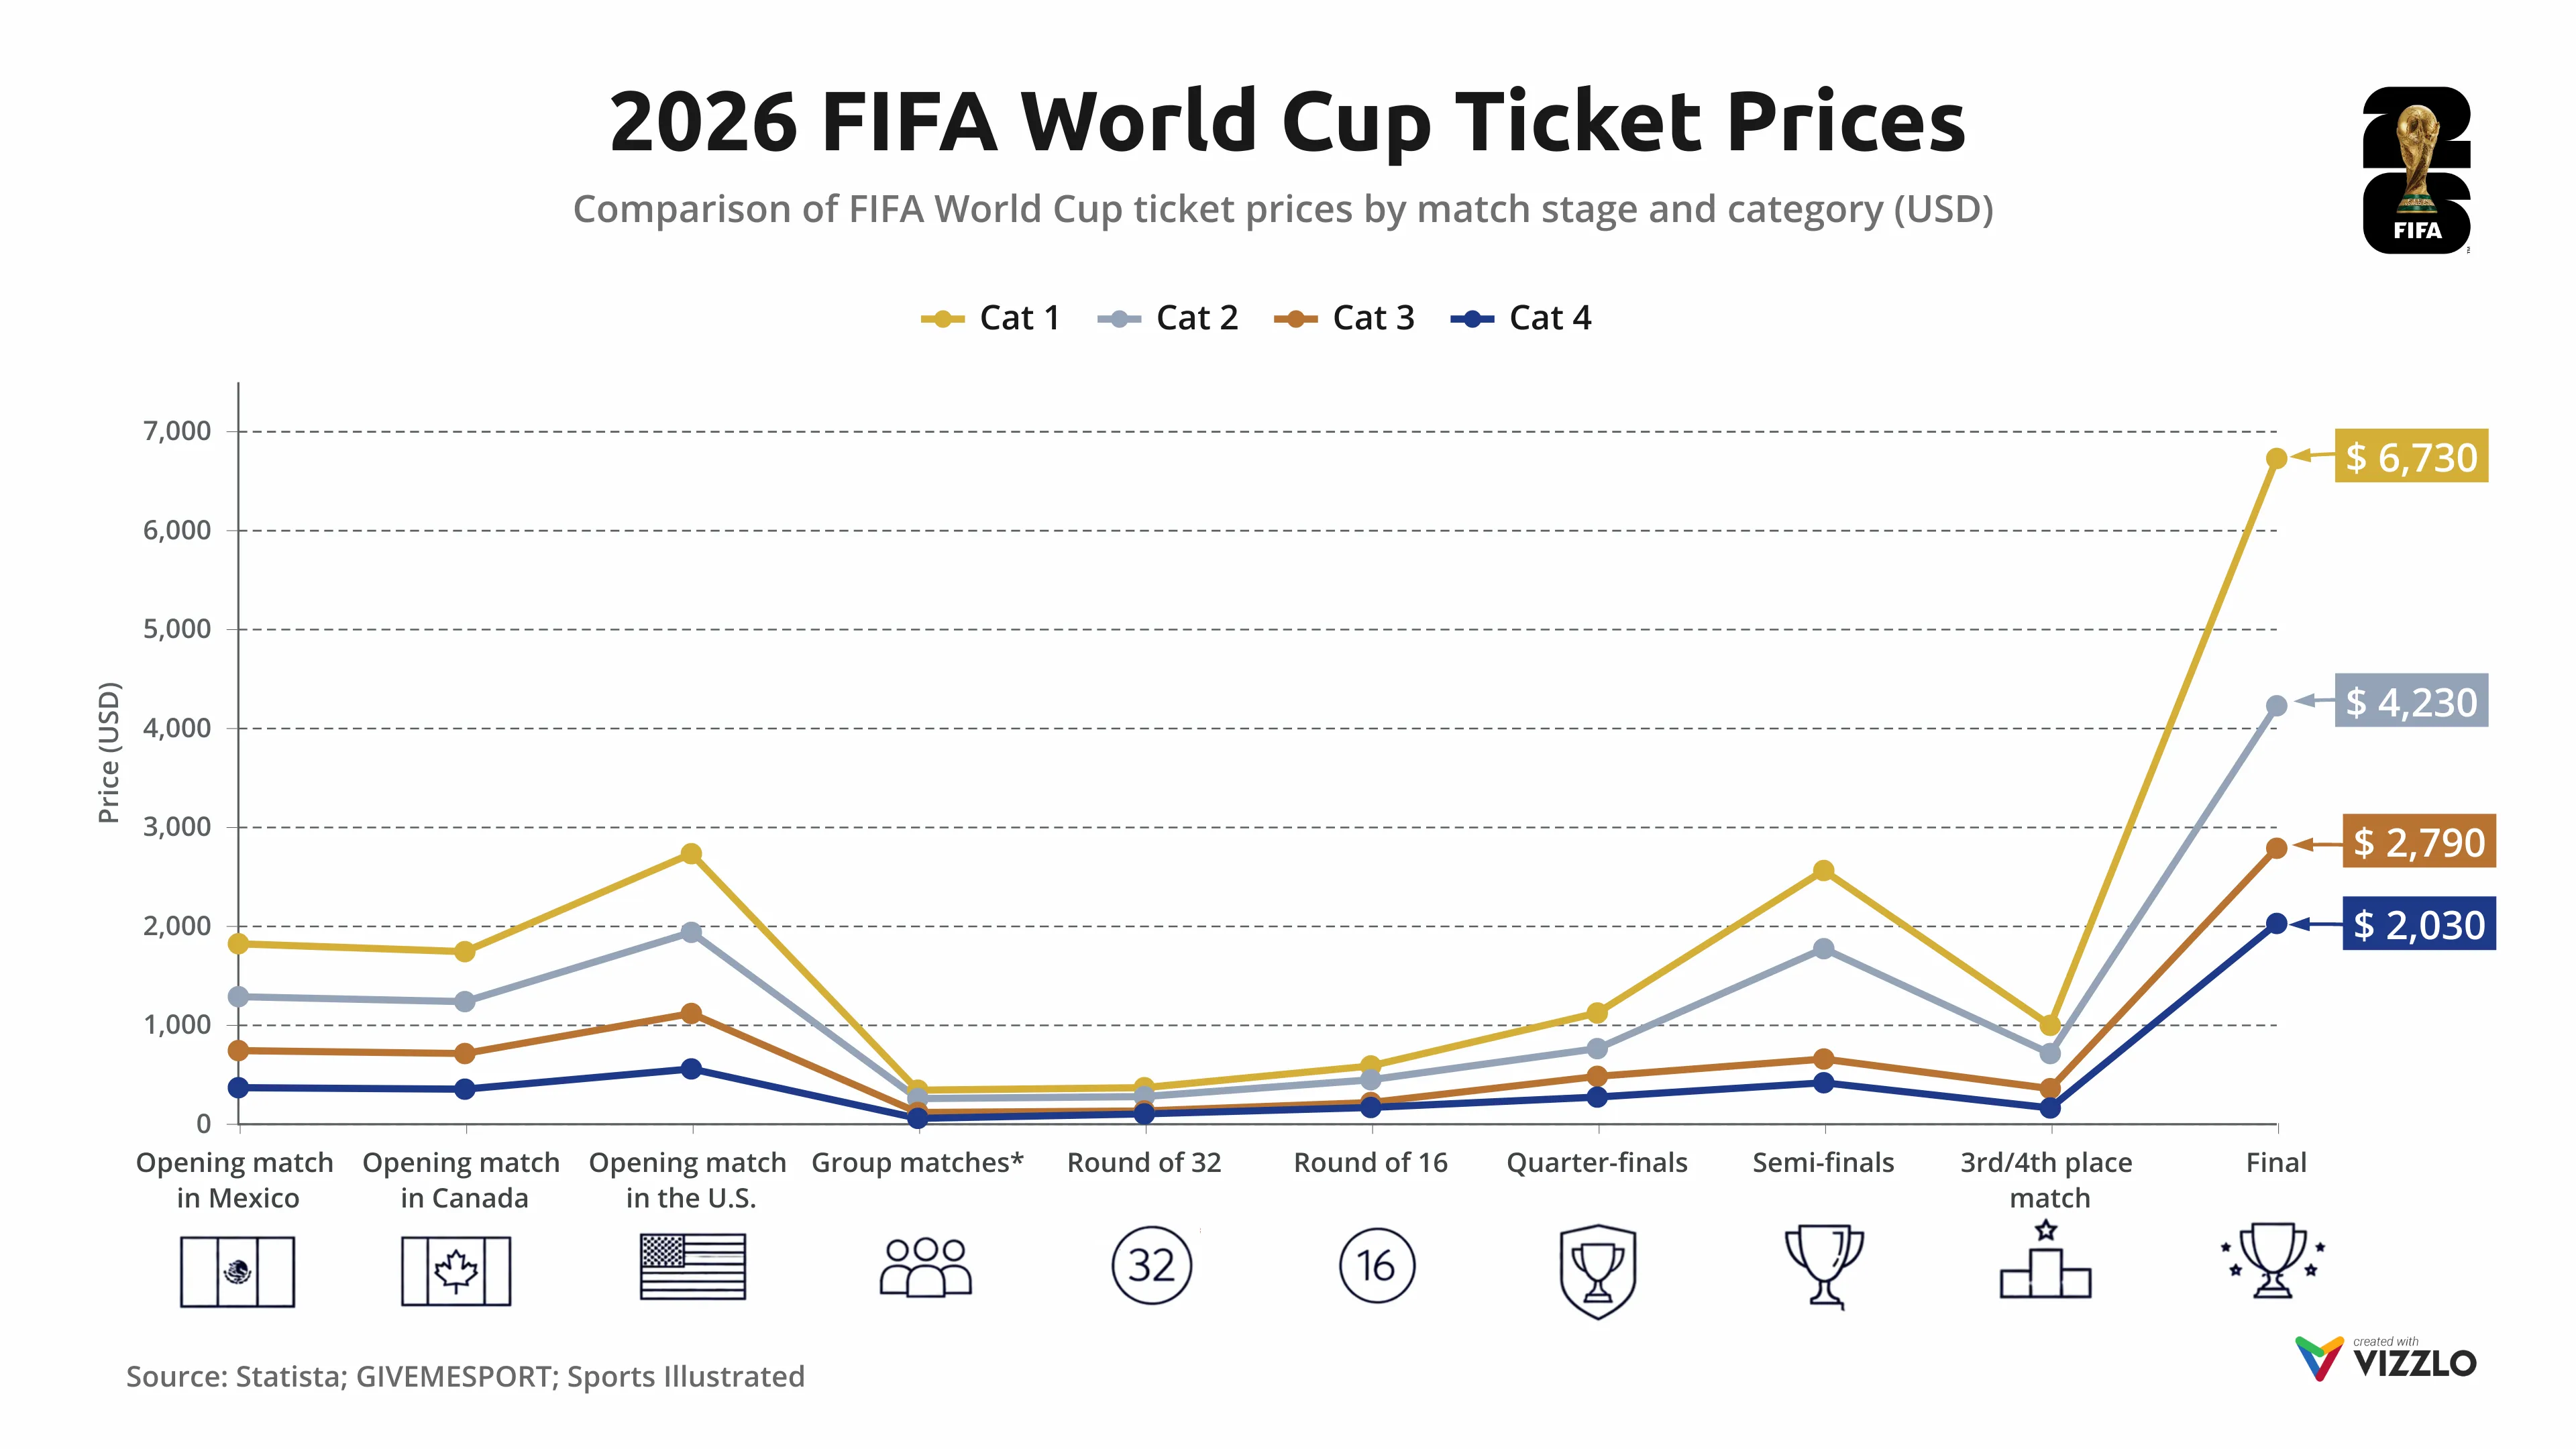
2026 FIFA World Cup Ticket Prices
This line chart visualizes the base ticket prices for the 2026 FIFA World Cup across different tournament stages and seating categories, ranging from the opening matches to the final. The visualization compares Category 1 through Category 4 ticket prices, highlighting how prices increase significantly as the tournament progresses toward the final stages.
The chart clearly demonstrates the steep pricing escalation for premium seats, particularly for the World Cup Final, where Category 1 tickets reached up to $6,730 during the initial ticket release phase in October 2025. In contrast, earlier-stage matches such as the group stage and Round of 32 remained comparatively affordable, emphasizing the massive demand gap between early matches and the tournament finale.
Using color-coded trend lines, stage icons, and a clean tournament progression layout, the visualization makes it easy to identify pricing patterns across match stages, compare seating categories, and understand how FIFA’s dynamic ticketing model impacts overall ticket costs. The visual also highlights the differences between opening matches hosted in Mexico, Canada, and the United States.
Designed for sports business presentations, data storytelling, and event industry analysis, this example demonstrates how to communicate pricing structures, demand-driven markets, and large-scale sporting event economics through professional and accessible visuals. It is particularly relevant for topics such as sports marketing, ticket pricing strategies, fan accessibility, dynamic pricing systems, and global event monetization.
This chart showcases how complex sports and pricing data can be transformed into clear, presentation-ready visuals suitable for consulting reports, media publications, sponsorship analysis, and market trend discussions.
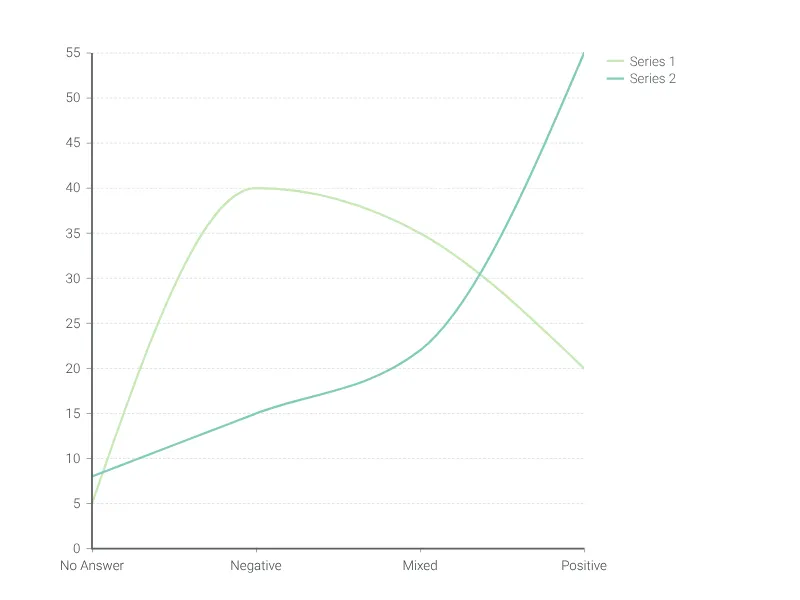
This is an example of Vizzlo's “Line Graph”
An easy, quick, and super versatile line graph maker.