Chart Vizzard
Vizzlo's AI-based chart generator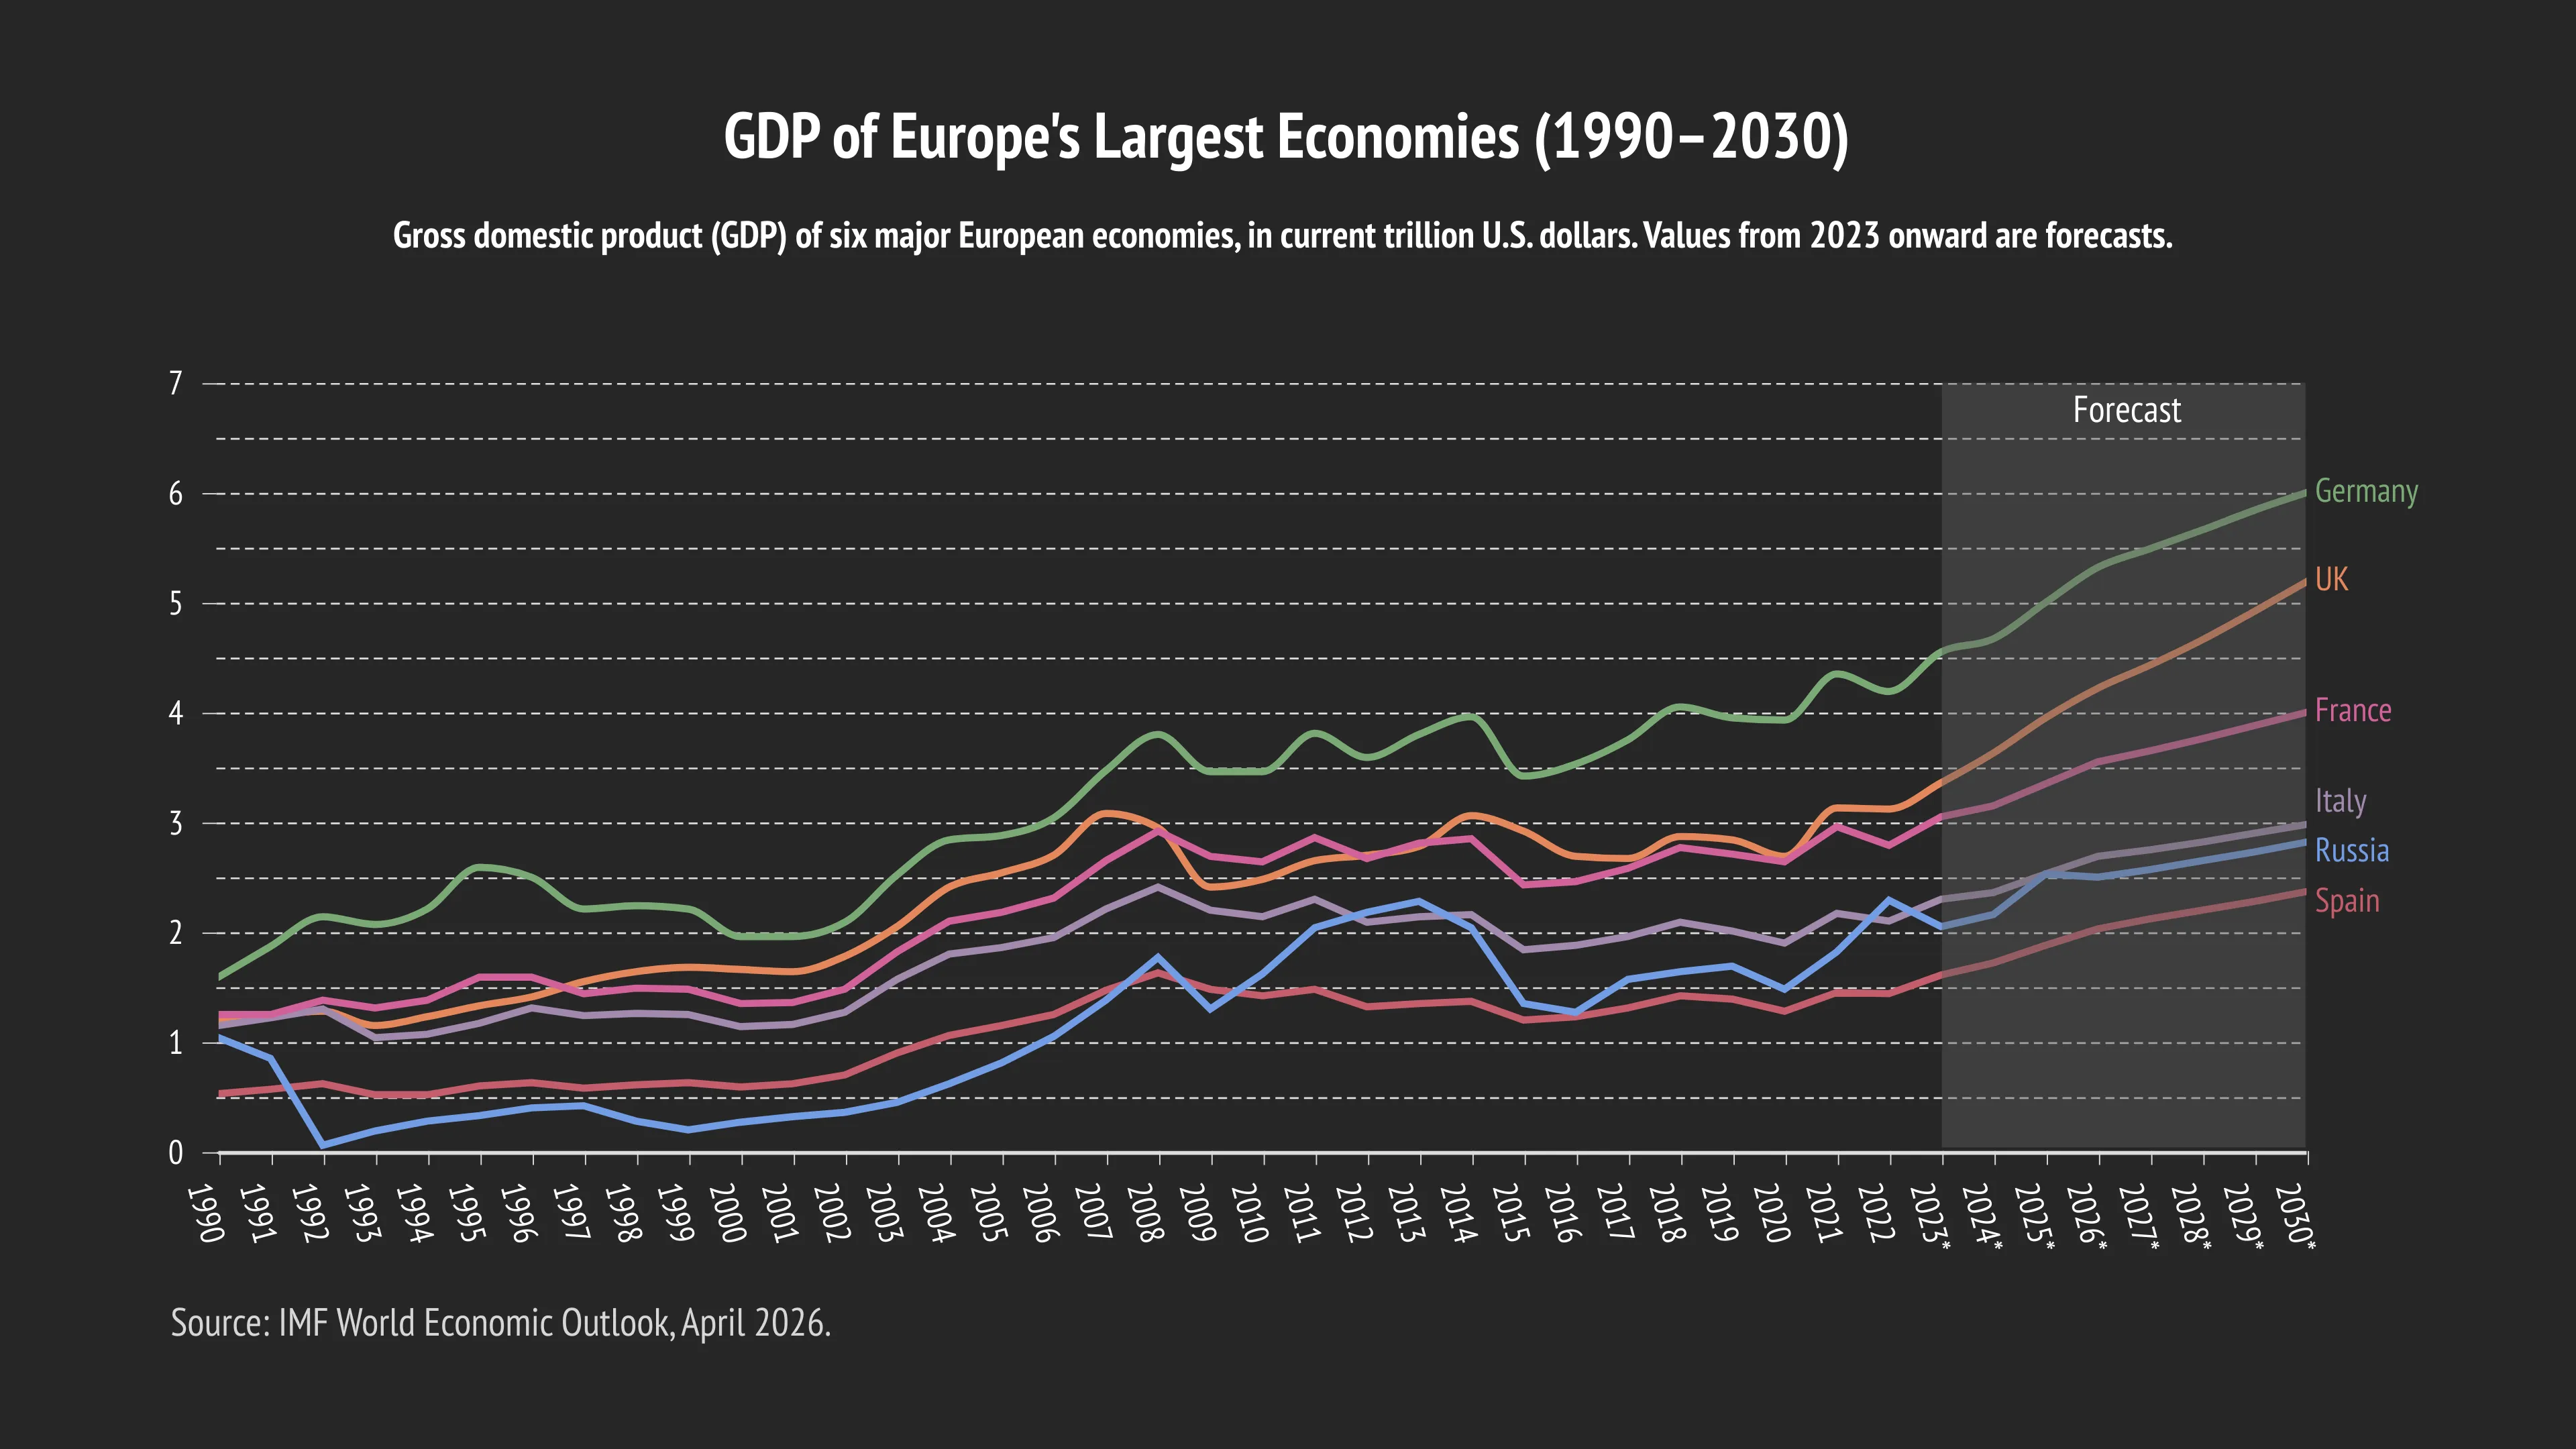
GDP of Europe's Largest Economies (1990–2030)
This line graph compares the gross domestic product (GDP) of Europe’s six largest economies from 1990 to 2030, measured in current trillion U.S. dollars. It illustrates how the economic size of Germany, the United Kingdom, France, Italy, Spain, and Russia has evolved over four decades, with forecast values shown from 2023 onward.
The visualization highlights several long-term trends. Germany has remained Europe’s largest economy throughout the period, while the United Kingdom and France have consistently occupied the next positions despite periods of slower growth. Italy’s economy gradually diverged from its larger Western European peers after the mid-2000s, whereas Spain experienced steady expansion before the global financial crisis and resumed moderate growth in recent years. Russia shows the greatest volatility, reflecting major economic and geopolitical events that have shaped its performance over time.
By displaying historical data and future projections in a continuous line chart—with forecast values clearly distinguished—the visualization makes it easy to compare long-term economic trajectories, identify turning points such as the 2008 financial crisis and the 2020 pandemic, and assess the projected growth outlook of Europe’s largest economies through 2030.
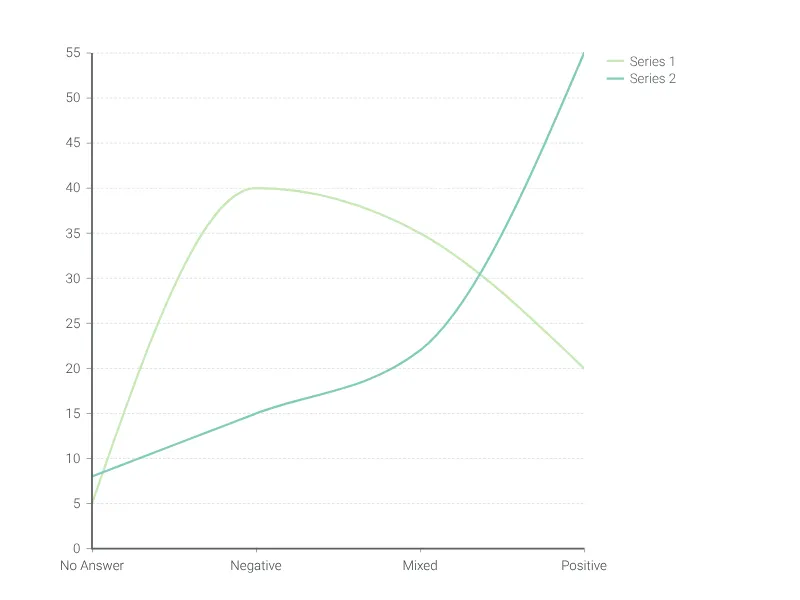
This is an example of Vizzlo's “Line Graph”
An easy, quick, and super versatile line graph maker.